Connecting Knock to your Datadog account
Learn more about how to connect Knock with your Datadog account.
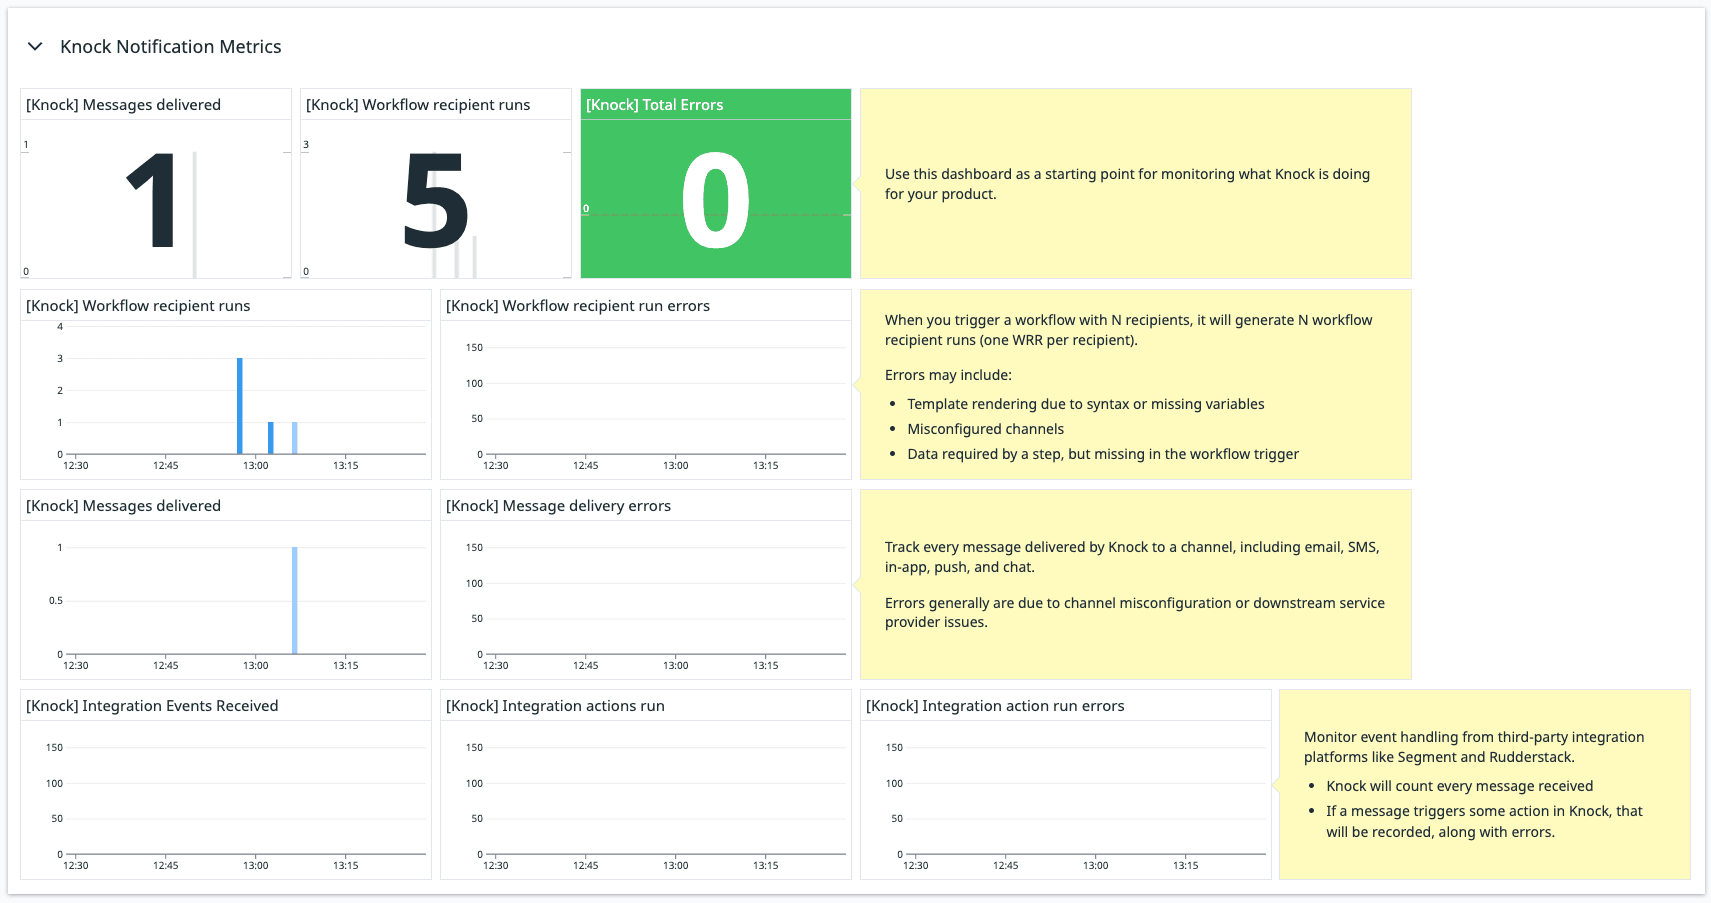
You can use the Knock + Datadog integration to stream workflow, channel, and message metrics from your Knock account to your Datadog account. With this you can:
- Set up custom Datadog monitors and dashboards to track your Knock workflows & channels
- Get up-to-the-minute data on workflows triggered and messages delivered
- Monitor events ingested and actions triggered from event platforms like Segment and RudderStack
What this integration does
#This integration will send a stream of metrics as they happen from your Knock account to your Datadog account. Metrics are prefixed knock.* and include success and failure codes. Metrics are tagged (where applicable) by:
- Environment
- Workflow key
- Workflow category
- Workflow exec mode
- Channel or workflow step type
- Channel provider
- Integration source type
- Error reason
Please refer to your Datadog pricing agreement for information on how custom metrics sent to Datadog are priced for your account.
At this time there is no way to selectively enable specific metrics, however metrics will only be emitted to Datadog for features that you are actively using in Knock.
A workflow can have one or more categories. For applicable metrics, each category will have a unique tag on the emitted metrics; a workflow with categories transactional and updates will have the tags workflow_category:transactional and workflow_category:updates.
Installing the integration
#- Visit the Extensions page under the Integrations section of your Knock dashboard account settings
- Click "Configure Datadog"
- Enter a Datadog API Key from Datadog's API Keys page (we recommend creating a dedicated key just for Knock)
- Pick the correct site for your Datadog account (visit Datadog's docs for more information)
- Click "Connect"
Dashboard starter kit
#Get started with our Datadog dashboard starter kit to start monitoring Knock metrics with just a few clicks:
- Visit Datadog's dashboard list and click "New Dashboard"
- Give it a name and click "New Dashboard"
- Click the gear icon in the corner of the dashboard and choose "Import dashboard JSON..."
- You may need to close the "Add Widgets" tray to see the gear icon
- Click the button below to copy the dashboard JSON, and paste it into the Datadog dashboard page when prompted.
Reported metrics
#How many messages have been delivered, segmented by channel, provider, workflow key, and workflow_category.
How many deliveries ended in a retryable failure, segmented by channel, provider, workflow key, and workflow_category.
How many deliveries ended in failure (not retryable), segmented by channel, provider, workflow key, and workflow_category.
How many deliveries ended in non-retryable errors from downstream providers, segmented by channel, provider, workflow key, and workflow_category.
How many workflow recipient runs have been started, segmented by workflow key, exec_mode, and workflow_category.
How many errors were experienced during a workflow recipient run, segmented by workflow key, exec_mode, step_type, workflow_category, and the error reason. A workflow recipient run can report more than one error.
The raw number of events received by Knock from an integration source, segmented by source_type.
How many actions were triggered by received events, segmented by source_type and action.
How many actions failed to run, segmented by source_type and action.
- All metrics are segmented by
environmentname (e.g.production,development) - For each of the error cases, the Knock dashboard can provide more insights into specific failures (e.g. misconfigured workflow, channel, or integration action)
Uninstalling the integration
#- Visit the Extensions page under the Integrations section of your Knock dashboard account settings
- Click the "Disconnect" button for the Datadog extension, and then click "Confirm"
- If you created a dedicated Datadog API key for Knock, you can now delete the key from Datadog's API Keys page